Note
Go to the end to download the full example code.
Quadratic
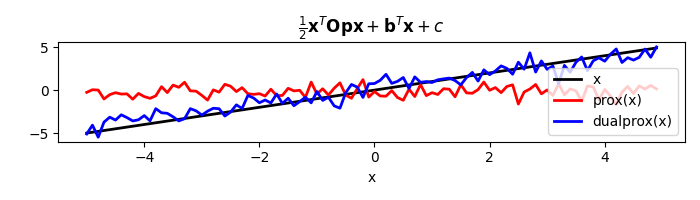
In this example we consider the proximal operator for a quadratic function:
\[\frac{1}{2} \mathbf{x}^T \mathbf{Op} \mathbf{x} + \mathbf{b}^T
\mathbf{x} + c.\]
which is implemented by the pyproximal.Quadratic class.
import matplotlib.pyplot as plt
import numpy as np
import pylops

import pyproximal

plt.close("all")
To start with cosider the most complete case when both \(\mathbf{Op}\) and \(\mathbf{Op}\) are non-null.
x = np.arange(-5, 5, 0.1)
nx = len(x)

A = np.random.normal(0, 1, (nx, nx))
A = A.T @ A
c = 2.0
quad = pyproximal.Quadratic(Op=pylops.MatrixMult(A), b=np.ones_like(x), c=c, niter=500)
print("1/2 x^T Op x + b^T x + c: ", quad(x))

tau = 4
xp = quad.prox(x, tau)
xdp = quad.proxdual(x, tau)

plt.figure(figsize=(7, 2))
plt.plot(x, x, "k", lw=2, label="x")
plt.plot(x, xp, "r", lw=2, label="prox(x)")
plt.plot(x, xdp, "b", lw=2, label="dualprox(x)")
plt.xlabel("x")
plt.title(
    r"$\frac{1}{2} \mathbf{x}^T \mathbf{Op} \mathbf{x} + "
    r"\mathbf{b}^T \mathbf{x} + c$"
)
plt.legend()
plt.tight_layout()
1/2 x^T Op x + b^T x + c: 53403.27754542528
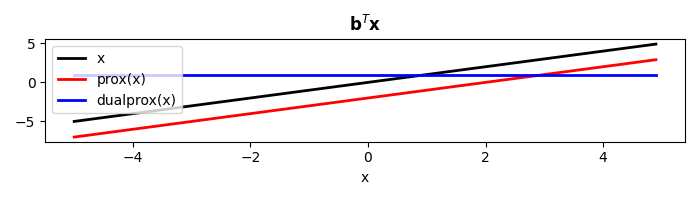
If we now assume that the operator \(\mathbf{Op}\) is null, the quadratic operator can be used to define the dot-product between \(\mathbf{x}\) and a vector \(\mathbf{b}\)
x = np.arange(-5, 5, 0.1)

dot = pyproximal.Quadratic(b=np.ones_like(x))
print("b^T x: ", quad(x))

tau = 2
xp = dot.prox(x, tau)
xdp = dot.proxdual(x, tau)

plt.figure(figsize=(7, 2))
plt.plot(x, x, "k", lw=2, label="x")
plt.plot(x, xp, "r", lw=2, label="prox(x)")
plt.plot(x, xdp, "b", lw=2, label="dualprox(x)")
plt.xlabel("x")
plt.title(r"$\mathbf{b}^T \mathbf{x}$")
plt.legend()
plt.tight_layout()
b^T x: 53403.27754542528
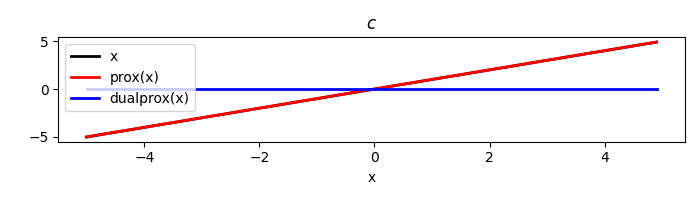
Finally if also \(\mathbf{b}\) is zero, the quadratic function reduces to a constant \(\mathbf{c}\) and its proximity operator becomes the vector \(\mathbf{x}\) itself.
x = np.arange(-5, 5, 0.1)

dot = pyproximal.Quadratic(c=5.0)
print("c: ", quad(x))

tau = 2
xp = dot.prox(x, tau)
xdp = dot.proxdual(x, tau)

plt.figure(figsize=(7, 2))
plt.plot(x, x, "k", lw=2, label="x")
plt.plot(x, xp, "r", lw=2, label="prox(x)")
plt.plot(x, xdp, "b", lw=2, label="dualprox(x)")
plt.xlabel("x")
plt.title(r"$c$")
plt.legend()
plt.tight_layout()
c: 53403.27754542528
Total running time of the script: (0 minutes 0.195 seconds)