
 PyProximal
Note
Go to the end to download the full example code.
MRI Imaging and Segmentation of Brain
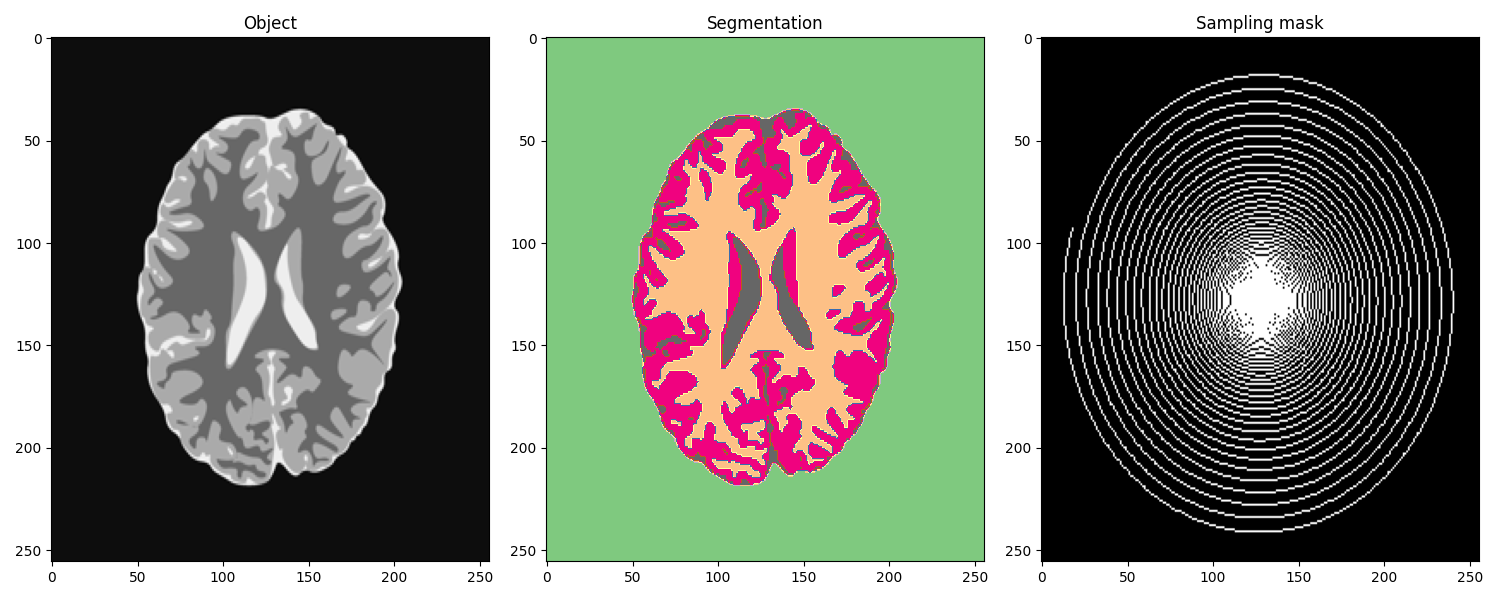
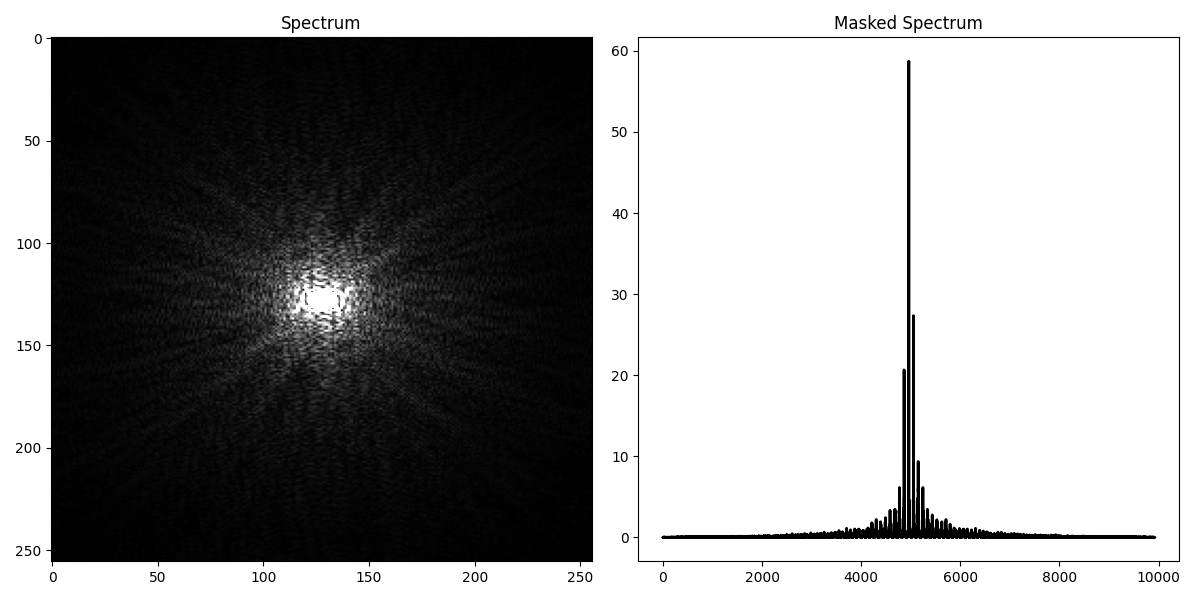
This tutorial considers the well-known problem of MRI imaging, where given the availability of a sparsely sampled KK-spectrum, one is tasked to reconstruct the underline spatial luminosity of an object under observation. In this specific case, we will be using an example from Corona et al., 2019, Enhancing joint reconstruction and segmentation with non-convex Bregman iteration.
We first consider the imaging problem defined by the following cost functuon
where the operator \(\mathbf{A}\) performs a 2D-Fourier transform followed by sampling of the KK plane, \(\mathbf{x}\) is the object of interest and \(\mathbf{y}\) the set of available Fourier coefficients.
Once the model is reconstructed, we solve a second inverse problem with the aim of segmenting the retrieved object into \(N\) classes of different luminosity.
import matplotlib.pyplot as plt
import numpy as np
import pylops
from scipy.io import loadmat

import pyproximal

plt.close("all")
np.random.seed(10)
Let’s start by loading the data and the sampling mask
mat = loadmat("../testdata/brainphantom.mat")
mat1 = loadmat("../testdata/spiralsampling.mat")
gt = mat["gt"]
seggt = mat["gt_seg"]
sampling = mat1["samp"]
sampling1 = np.fft.ifftshift(sampling)

fig, axs = plt.subplots(1, 3, figsize=(15, 6))
axs[0].imshow(gt, cmap="gray")
axs[0].axis("tight")
axs[0].set_title("Object")
axs[1].imshow(seggt, cmap="Accent")
axs[1].axis("tight")
axs[1].set_title("Segmentation")
axs[2].imshow(sampling, cmap="gray")
axs[2].axis("tight")
axs[2].set_title("Sampling mask")
plt.tight_layout()
We can now create the MRI operator
Fop = pylops.signalprocessing.FFT2D(dims=gt.shape)
Rop = pylops.Restriction(
    gt.size, np.where(sampling1.ravel() == 1)[0], dtype=np.complex128
)
Dop = Rop * Fop

# KK spectrum
GT = Fop * gt.ravel()
GT = GT.reshape(gt.shape)

# Data (Masked KK spectrum)
d = Dop * gt.ravel()

fig, axs = plt.subplots(1, 2, figsize=(12, 6))
axs[0].imshow(np.fft.fftshift(np.abs(GT)), vmin=0, vmax=1, cmap="gray")
axs[0].axis("tight")
axs[0].set_title("Spectrum")
axs[1].plot(np.fft.fftshift(np.abs(d)), "k", lw=2)
axs[1].axis("tight")
axs[1].set_title("Masked Spectrum")
plt.tight_layout()
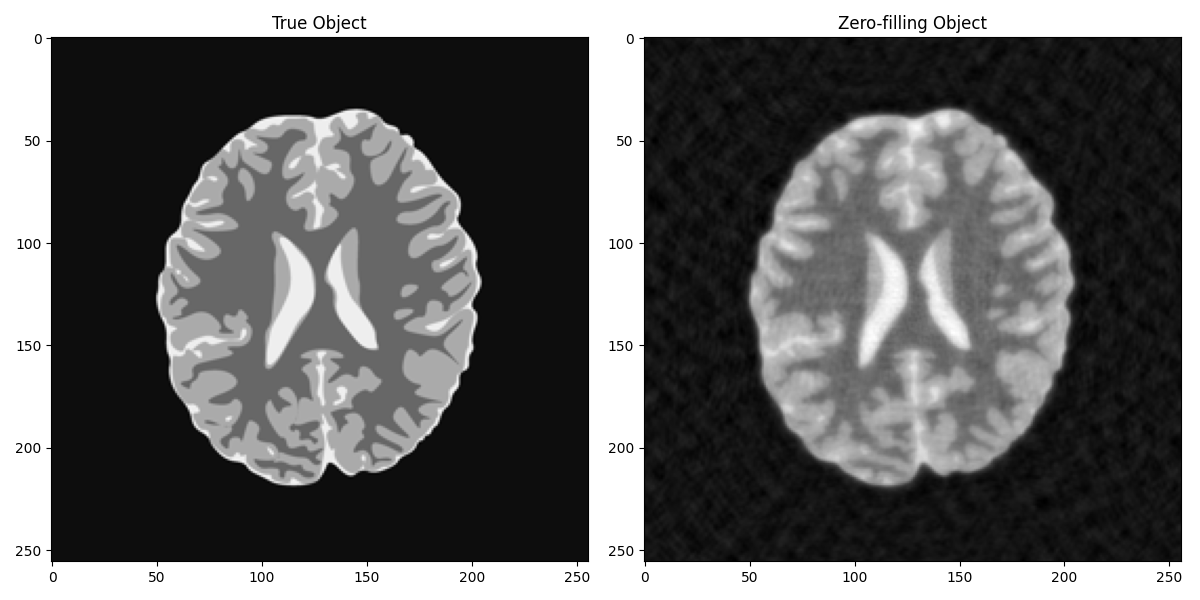
Let’s try now to reconstruct the object from its measurement. The simplest approach entails simply filling the missing values in the KK spectrum with zeros and applying inverse FFT.
GTzero = sampling1 * GT
gtzero = (Fop.H * GTzero).real

fig, axs = plt.subplots(1, 2, figsize=(12, 6))
axs[0].imshow(gt, cmap="gray")
axs[0].axis("tight")
axs[0].set_title("True Object")
axs[1].imshow(gtzero, cmap="gray")
axs[1].axis("tight")
axs[1].set_title("Zero-filling Object")
plt.tight_layout()
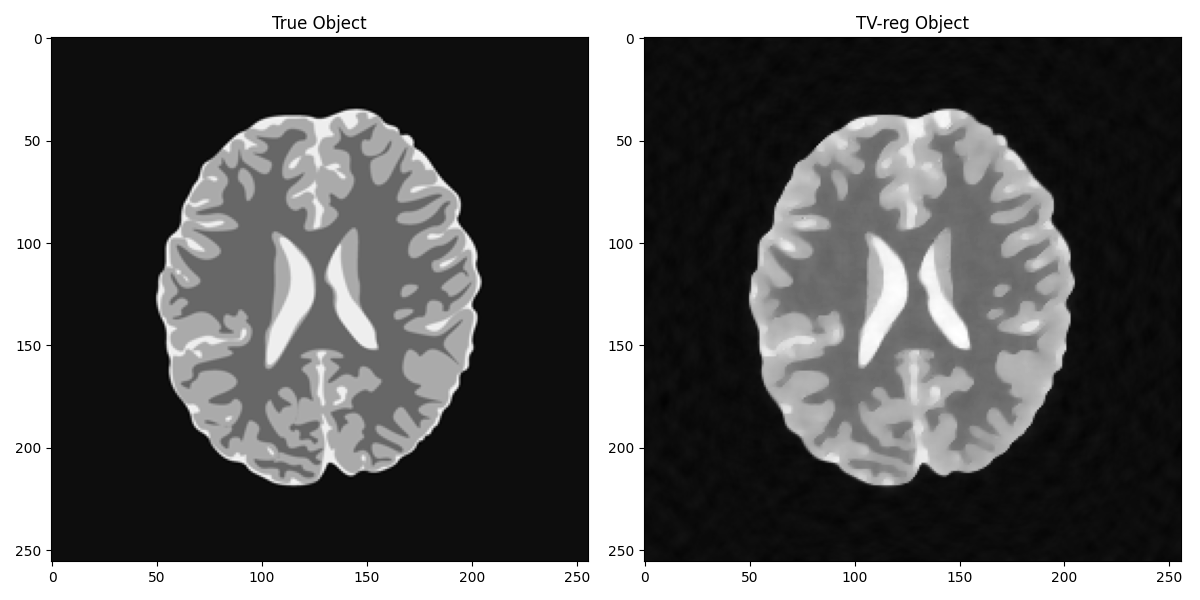
We can now do better if we introduce some prior information in the form of TV on the solution
with pylops.disabled_ndarray_multiplication():
    sigma = 0.04
    l1 = pyproximal.proximal.L21(ndim=2)
    l2 = pyproximal.proximal.L2(Op=Dop, b=d.ravel(), niter=50, warm=True)
    Gop = sigma * pylops.Gradient(
        dims=gt.shape, edge=True, kind="forward", dtype=np.complex128
    )

    L = sigma**2 * 8
    tau = 0.99 / np.sqrt(L)
    mu = 0.99 / np.sqrt(L)

    gtpd = pyproximal.optimization.primaldual.PrimalDual(
        l2,
        l1,
        Gop,
        x0=np.zeros(gt.size, dtype=np.complex128),
        tau=tau,
        mu=mu,
        theta=1.0,
        niter=100,
        show=True,
    )
    gtpd = np.real(gtpd.reshape(gt.shape))

fig, axs = plt.subplots(1, 2, figsize=(12, 6))
axs[0].imshow(gt, cmap="gray")
axs[0].axis("tight")
axs[0].set_title("True Object")
axs[1].imshow(gtpd, cmap="gray")
axs[1].axis("tight")
axs[1].set_title("TV-reg Object")
plt.tight_layout()
/home/docs/checkouts/readthedocs.org/user_builds/pyproximal/checkouts/latest/pyproximal/proximal/L21.py:69: ComplexWarning: Casting complex values to real discards the imaginary part
  return float(f)
PrimalDual
-------------------------------------------------------------------------------------
Proximal operator (f): L2
Proximal operator (g): L21
Linear operator (A): _ScaledLinearOperator
Additional vector (z): None

tau = 8.750446  mu = 8.750446   theta = 1.00e+00
tol = None      niter = 100
-------------------------------------------------------------------------------------

    Itn              x[0]                      f          g           z^x        J=f+g+z^x
     1        4.17e-02-4.38e-02j          4.1322e+01  5.6427e+01   0.0000e+00   9.7750e+01
     2        4.08e-02-3.93e-02j          5.1851e-01  6.0817e+01   0.0000e+00   6.1335e+01
     3        3.46e-02-2.97e-02j          1.2927e-01  6.0553e+01   0.0000e+00   6.0682e+01
     4        2.82e-02-2.08e-02j          2.1275e-01  5.9897e+01   0.0000e+00   6.0110e+01
     5        2.32e-02-1.38e-02j          3.2707e-01  5.9237e+01   0.0000e+00   5.9564e+01
     6        1.99e-02-9.02e-03j          4.6240e-01  5.8606e+01   0.0000e+00   5.9068e+01
     7        1.84e-02-6.07e-03j          6.1642e-01  5.8004e+01   0.0000e+00   5.8621e+01
     8        1.84e-02-4.55e-03j          7.8744e-01  5.7431e+01   0.0000e+00   5.8218e+01
     9        1.95e-02-3.98e-03j          9.7395e-01  5.6884e+01   0.0000e+00   5.7858e+01
    10        2.12e-02-3.95e-03j          1.1746e+00  5.6363e+01   0.0000e+00   5.7537e+01
    11        2.33e-02-4.06e-03j          1.3871e+00  5.5850e+01   0.0000e+00   5.7237e+01
    21        4.47e-02+1.82e-02j          2.9415e+00  5.4014e+01   0.0000e+00   5.6955e+01
    31        4.41e-02+1.43e-02j          3.8078e+00  5.3241e+01   0.0000e+00   5.7048e+01
    41        2.53e-02+2.85e-02j          4.7415e+00  4.9750e+01   0.0000e+00   5.4492e+01
    51        3.34e-02+3.24e-02j          5.4632e+00  4.9406e+01   0.0000e+00   5.4869e+01
    61        4.14e-02+2.81e-03j          5.8643e+00  4.9962e+01   0.0000e+00   5.5827e+01
    71        6.62e-02+2.01e-02j          6.0795e+00  4.9943e+01   0.0000e+00   5.6022e+01
    81        3.41e-02+2.64e-02j          6.2034e+00  4.9183e+01   0.0000e+00   5.5386e+01
    91        4.35e-02+1.62e-02j          6.2895e+00  4.8863e+01   0.0000e+00   5.5153e+01
    92        4.46e-02+1.54e-02j          6.2986e+00  4.8711e+01   0.0000e+00   5.5010e+01
    93        4.62e-02+1.52e-02j          6.3058e+00  4.8566e+01   0.0000e+00   5.4871e+01
    94        4.74e-02+1.59e-02j          6.3128e+00  4.8445e+01   0.0000e+00   5.4758e+01
    95        4.80e-02+1.81e-02j          6.3193e+00  4.8312e+01   0.0000e+00   5.4632e+01
    96        4.79e-02+2.00e-02j          6.3260e+00  4.8168e+01   0.0000e+00   5.4494e+01
    97        4.80e-02+2.25e-02j          6.3322e+00  4.8091e+01   0.0000e+00   5.4423e+01
    98        4.77e-02+2.47e-02j          6.3381e+00  4.7979e+01   0.0000e+00   5.4317e+01
    99        4.66e-02+2.53e-02j          6.3418e+00  4.7947e+01   0.0000e+00   5.4289e+01
   100        4.59e-02+2.49e-02j          6.3457e+00  4.8095e+01   0.0000e+00   5.4441e+01

Iterations = 100        Total time (s) = 2.41
-------------------------------------------------------------------------------------
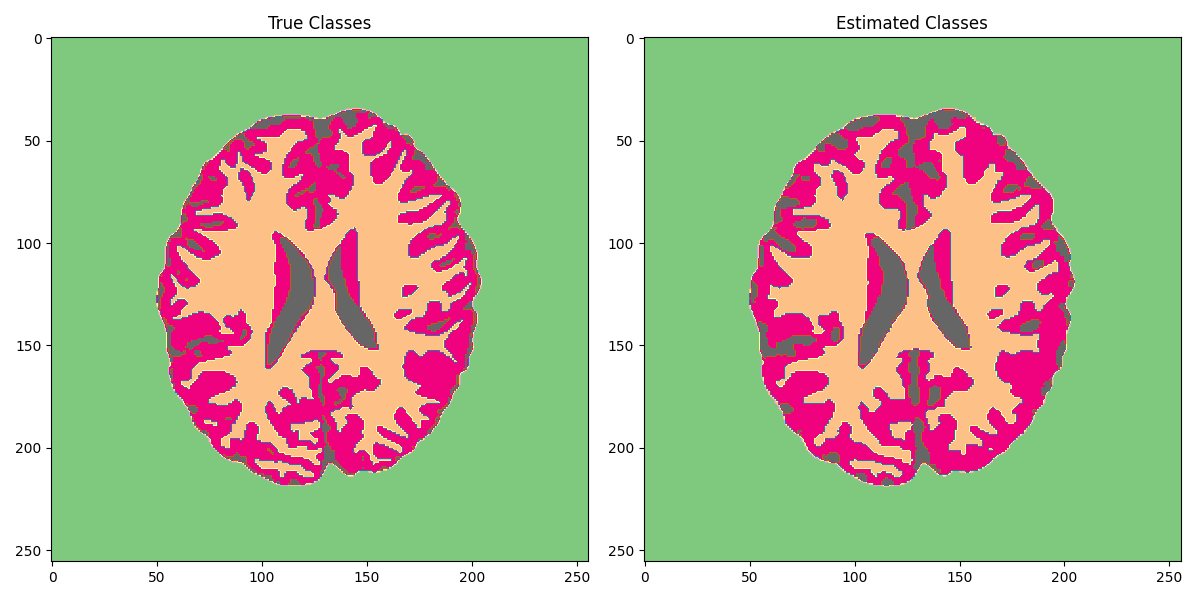
Finally we segment our reconstructed model into 4 classes.
cl = np.array([0.01, 0.43, 0.65, 0.8])
ncl = len(cl)
segpd_prob, segpd = pyproximal.optimization.segmentation.Segment(
    gtpd, cl, 1.0, 0.001, niter=10, show=True, kwargs_simplex=dict(engine="numba")
)

fig, axs = plt.subplots(1, 2, figsize=(12, 6))
axs[0].imshow(seggt, cmap="Accent")
axs[0].axis("tight")
axs[0].set_title("True Classes")
axs[1].imshow(segpd, cmap="Accent")
axs[1].axis("tight")
axs[1].set_title("Estimated Classes")
plt.tight_layout()
PrimalDual
-------------------------------------------------------------------------------------
Proximal operator (f): _Simplex_numba
Proximal operator (g): VStack
Linear operator (A): BlockDiag
Additional vector (z): vector

tau = 1.0       mu = 0.125      theta = 1.00e+00
tol = None      niter = 10
-------------------------------------------------------------------------------------

    Itn           x[0]                 f            g          z^x       J=f+g+z^x
     1         3.8464e-01          0.0000e+00  6.3517e-01   4.6079e+03   4.6085e+03
     2         5.0275e-01          0.0000e+00  9.4138e-01   2.7811e+03   2.7820e+03
     3         5.8705e-01          0.0000e+00  1.1447e+00   2.0252e+03   2.0264e+03
     4         6.4512e-01          0.0000e+00  1.2593e+00   1.5512e+03   1.5524e+03
     5         6.8107e-01          0.0000e+00  1.4196e+00   1.3900e+03   1.3914e+03
     6         7.1704e-01          0.0000e+00  1.5725e+00   1.2376e+03   1.2391e+03
     7         7.5304e-01          0.0000e+00  1.7186e+00   1.0914e+03   1.0931e+03
     8         7.8904e-01          0.0000e+00  1.8456e+00   9.5238e+02   9.5423e+02
     9         8.2506e-01          0.0000e+00  1.9626e+00   8.2922e+02   8.3118e+02
    10         8.6109e-01          0.0000e+00  2.0871e+00   7.1336e+02   7.1545e+02

Iterations = 10        Total time (s) = 7.20
-------------------------------------------------------------------------------------
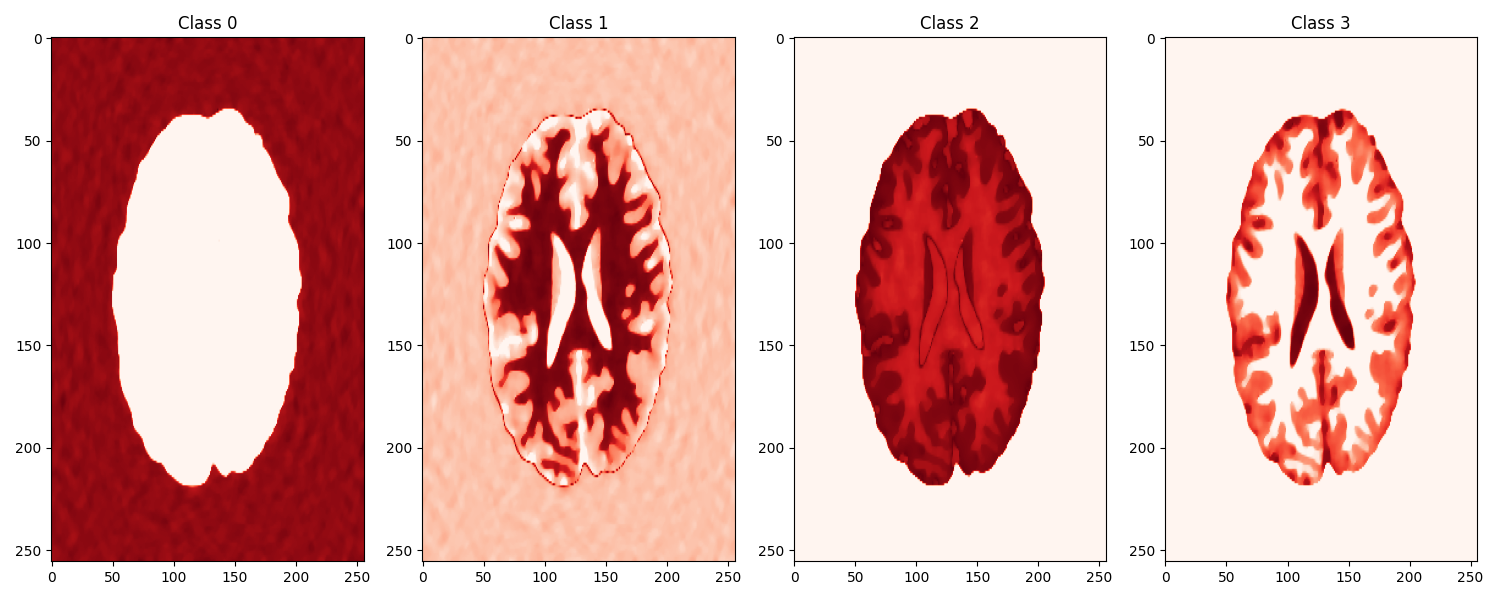
And we also visualize the segmented classes.
Total running time of the script: (0 minutes 11.626 seconds)